AgentX Support - AI agent analytics
The Analytics page provides insights into how your AI agent is performing. It includes metrics related to answers, resolutions, guides, and customer feedback.
You can view analytics for an AI agent by selecting Analytics in the sidebar.
Overview
The Overview tab provides a high-level summary of AI agent performance. It includes the following metrics:
| Metric | Definition |
|---|---|
| Sessions | Number of chat conversations that were started. |
| Self Service Rate | Percentage of conversations resolved without agent handover. (Calculated as: (Conversations without handover / Total conversations) × 100) |
| Confirmed Resolutions | Number of conversations marked as helpful by customers, without agent handover. |
| Informed | Number of conversations where an answer was shown to inform the customer. |
| Agent Handovers | Number of conversations that resulted in escalation or requests to speak with an agent. |
| Time in Widget | Total time customers spent in the chat widget (in seconds). |
| Conversation Count Over Time | Visualization showing daily conversation volume. X-axis: Date Y-axis: Number of conversations |
| Top-Level Metrics Over Time | Combined chart showing: X-axis: Date Y-axis: - Conversations - Agent Handovers - Resolved Conversations - Successful Conversations - Self Service Rate |
Chat widget
| Metric | Definition |
|---|---|
| Locale Breakdown | Visualization of the top customer locales. |
| Device Breakdown | Devices used to access the chat widget. |
| Browser Breakdown | Browsers used to access the chat widget. |
Flows
Displays the top flows used in conversations.
Answer performance
The Answer performance tab provides insight into how answers are performing, based on customer feedback.
| Metric | Definition |
|---|---|
| Sessions | Number of chat conversations started. |
| Self Service Rate | Percentage of conversations deflected by answers. (Calculated as: (Deflected conversations / Total conversations) × 100) |
| Informed | Number of conversations where an answer was shown to inform the customer. |
| Confirmed Resolution | Number of conversations marked as helpful by customers, without agent handover. |
| Conversations Leading to Confirmed Resolution | Waterfall visualization showing how many conversations included answers and how many of those were confirmed as helpful. |
| Types of Answers Presented | Breakdown of answer formats presented: - Link - Article - Guide - Flow |
| Top Answers | Table showing answer titles, URLs, number of times presented, and number of distinct uses. |
| Answer Feedback | Table showing the number of positive and negative feedback responses per answer. |
| Top Answers to Review | Answers that received feedback indicating they were not helpful. |
| Top Links Clicked | Most clicked URLs from answers and AI agent interactions. |
Guides in chat conversations
Interactions and feedback appear in this section if your AI agent uses Guides.
| Metric | Definition |
|---|---|
| Guides Used in Conversations | Shows guide names, URLs, and how often each was used in conversations. |
| Guide Feedback | Number of times each guide was marked helpful or not helpful by customers. |
Customer satisfaction
Customer satisfaction results are displayed in this section if you collect feedback through the AI agent.
| Metric | Definition |
|---|---|
| Overall CSAT | Average customer satisfaction (CSAT) rating (1–5 scale). |
| Number of Responses | Total number of CSAT responses collected. |
| Rating Distribution | Distribution of CSAT ratings across conversations. |
| CSAT Responses | Customer responses including: - Rating (1–5) - Feedback tags - Comments - Outcome (Resolved / Not Resolved) |
| Avg. CSAT Over Time | Graph showing how CSAT ratings have changed over time. |
| Outcome Distribution | Distribution of resolved versus unresolved outcomes. |
| Positive Feedback Detail | Breakdown of positive feedback categories: - Efficient Chat - Friendly - Helpful Resolutions - Knowledgeable Support - Understood My Needs |
| Negative Feedback Detail | Breakdown of negative feedback categories: - Did Not Understand - Technical Issues - Took Too Long - Unfriendly - Unhelpful Answers |
Filter the dashboard
Use filters to drill into specific segments of your analytics.
| Filter | Definition |
|---|---|
| Date Range | Select the time period for the analytics view. (Defaults to last week) |
| Conversation Action | Filter based on specific types of actions or outcomes. |
| Dimensions | Filter by custom dimensions such as product, UTM parameters, and more for deeper analysis. |
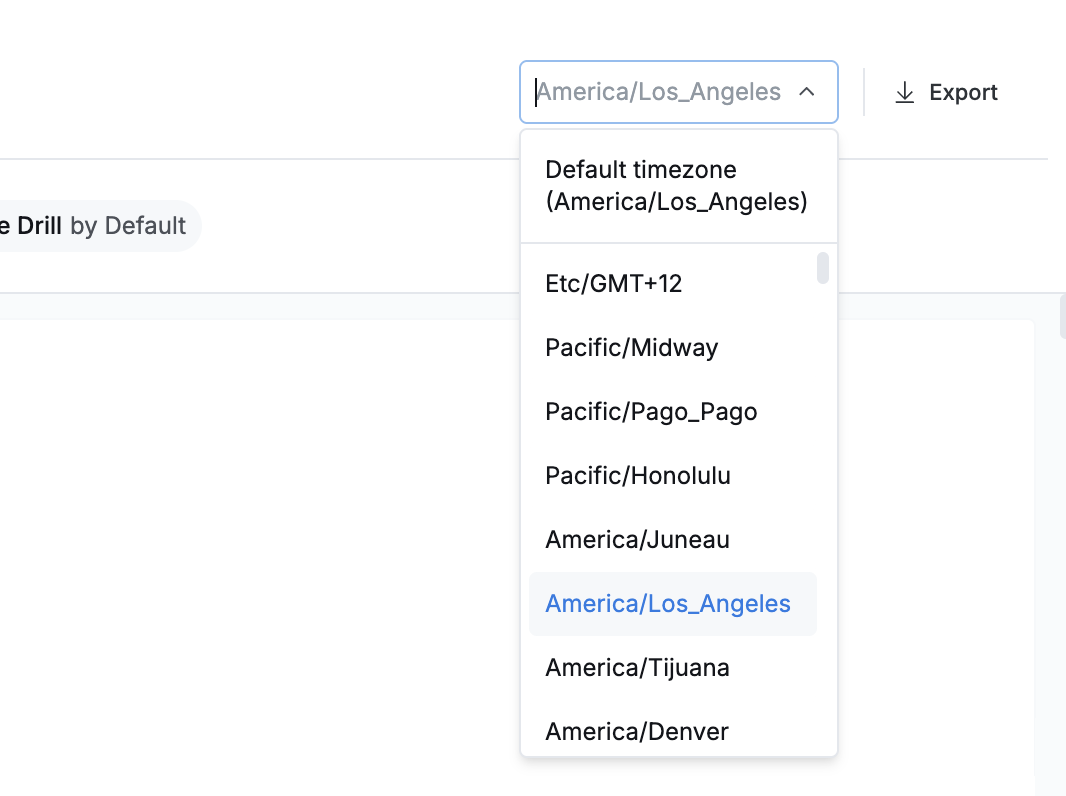
Change the timezone
You can change the timezone from the drop-down menu.
 Change timezone
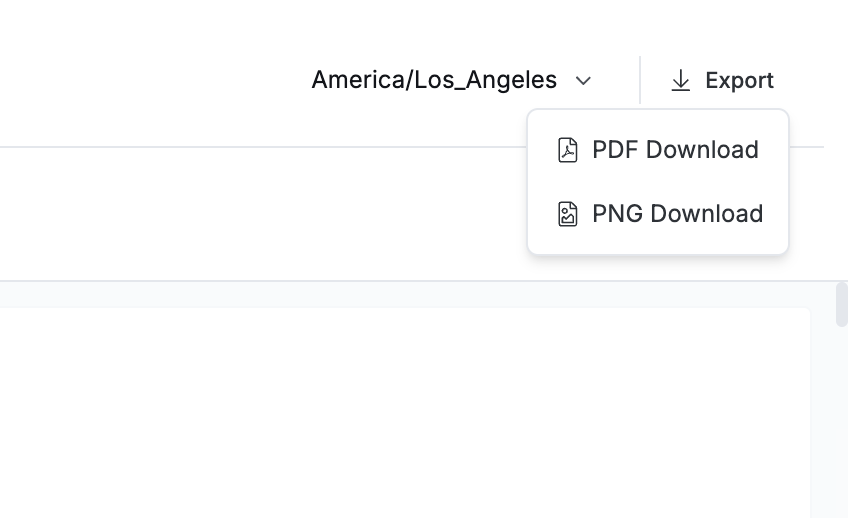
Export analytics
Click Export to download the current view as a PDF or PNG for sharing.
 Export analytics
Last updated: