View dashboards
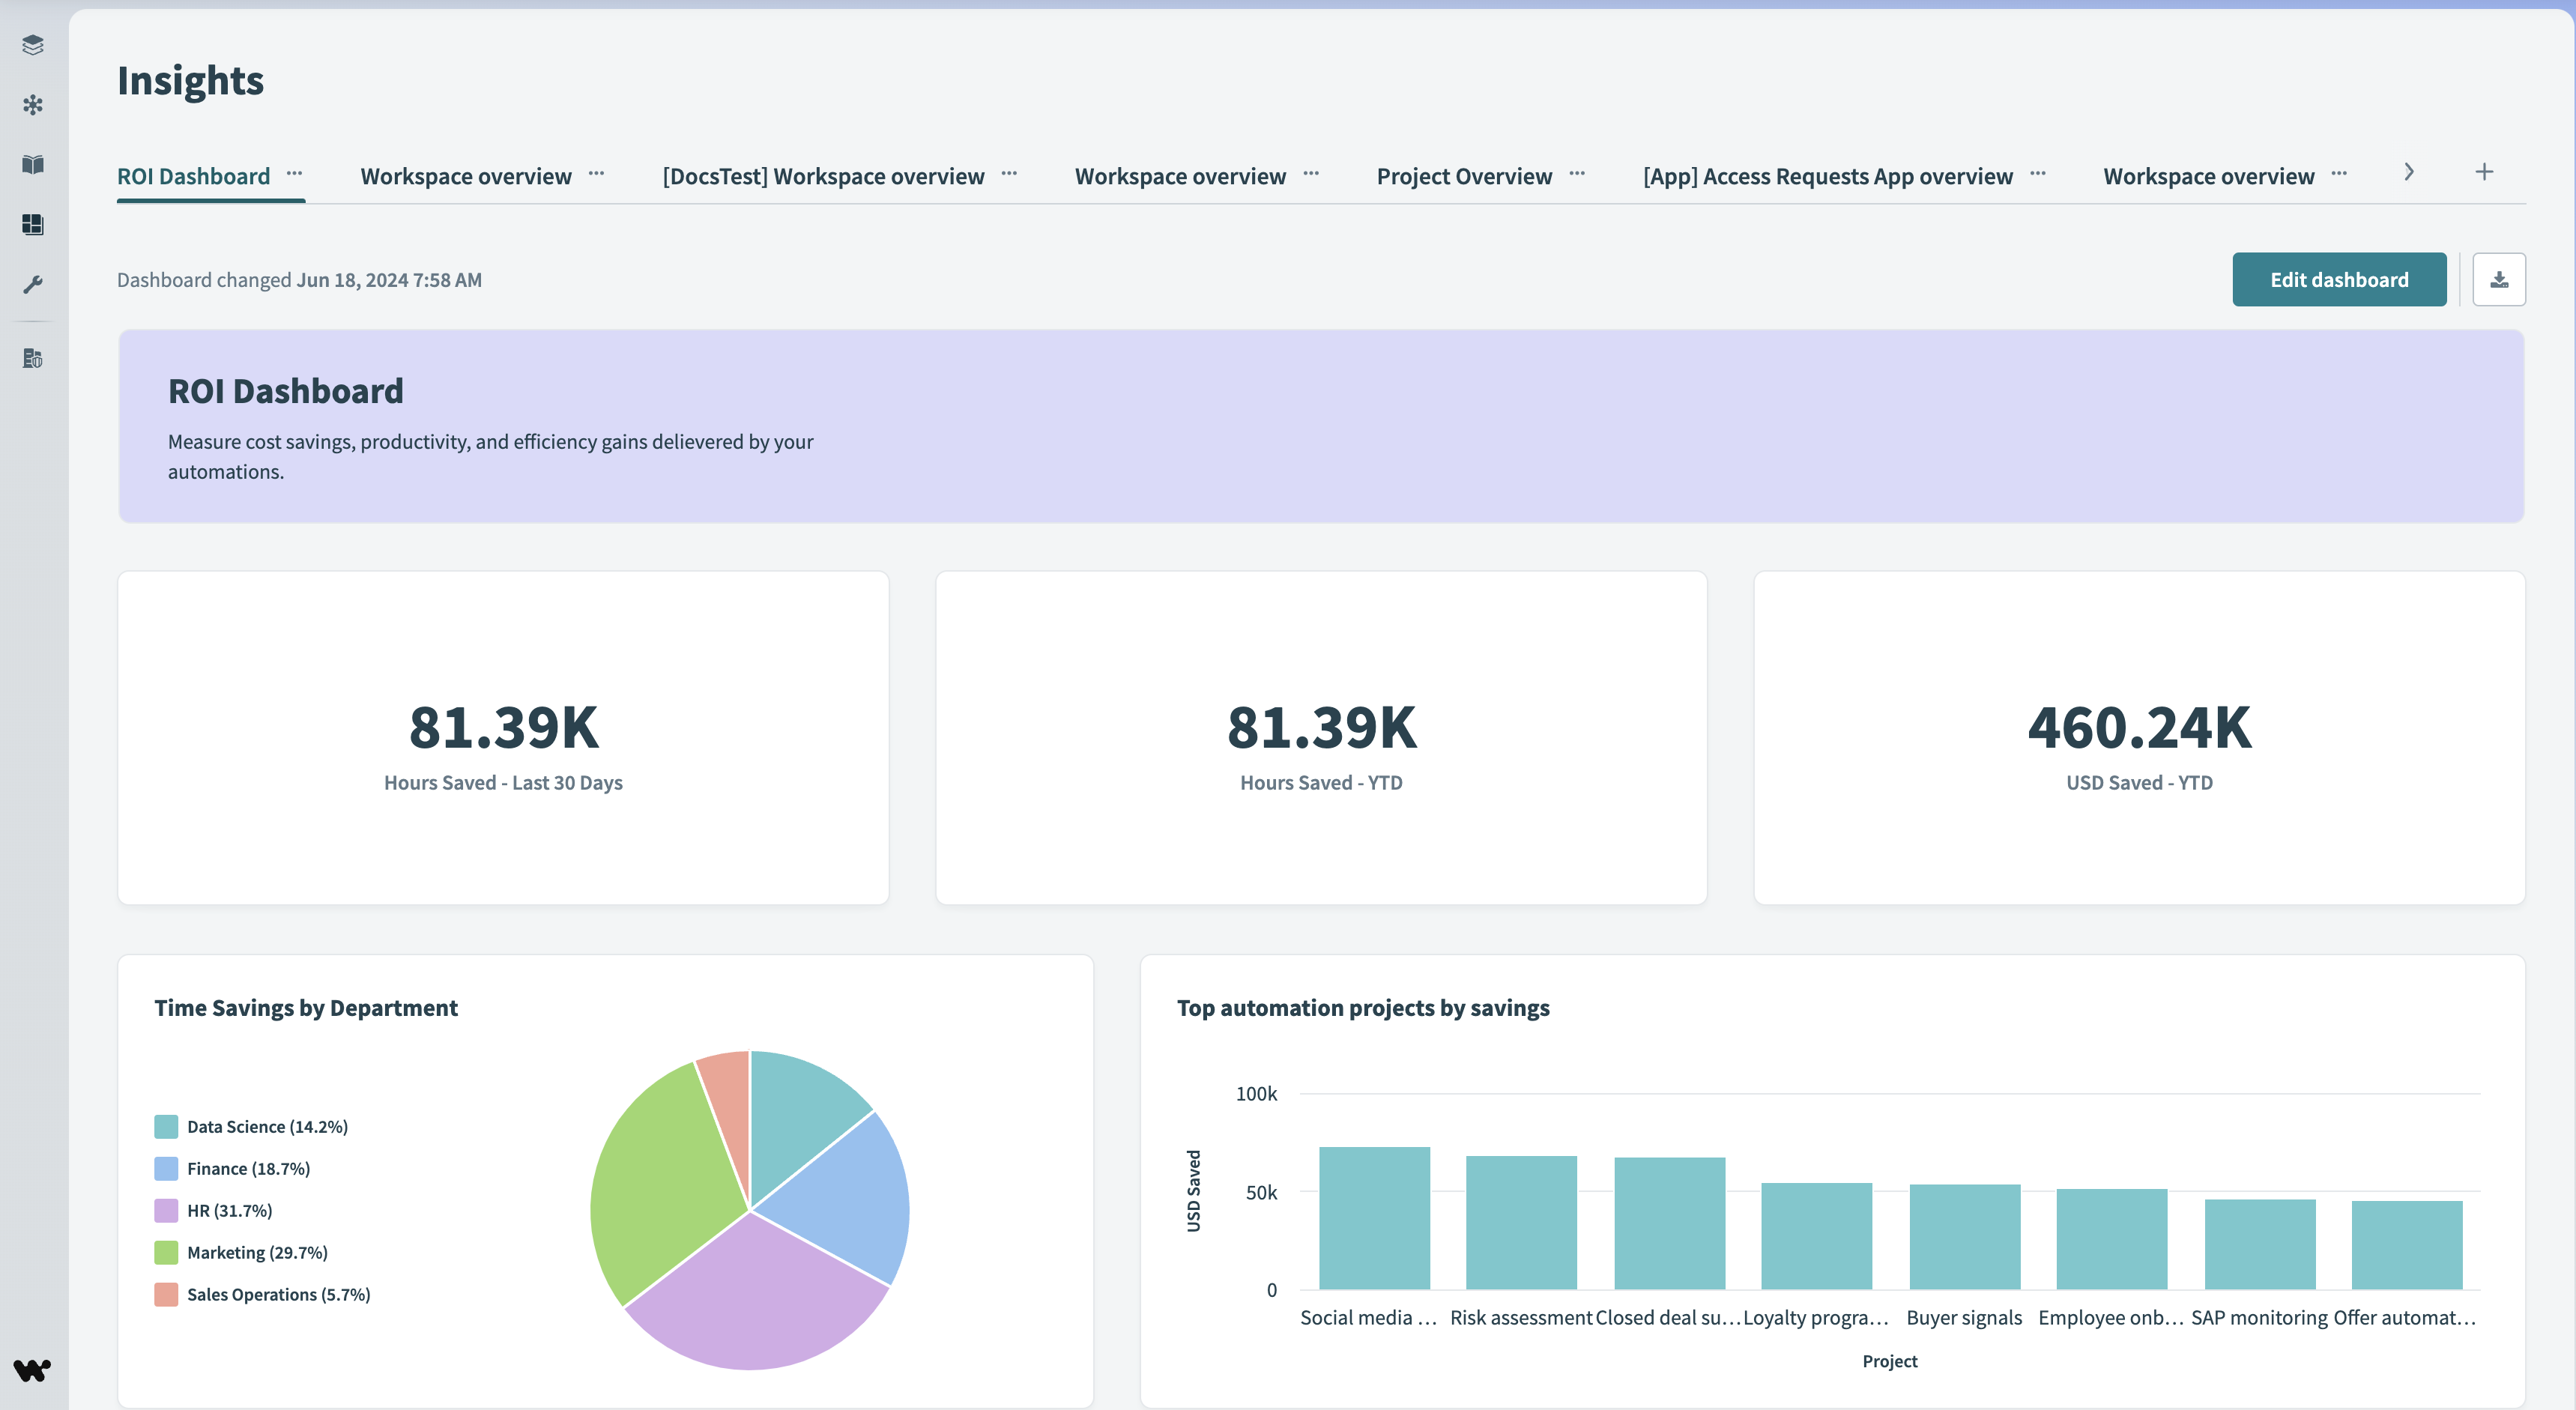
Insights dashboards pull data in real time, automatically incorporating the latest recipe runs and job executions without requiring manual or scheduled updates.
 View dashboards
Dashboards are shared within the workspace, making it easy to collaborate on data analysis and share insights with your team.
Use filter groups to adjust dashboard data
Filter groups let you apply multiple filters at once across different datasets and visualizations in a dashboard. This ensures consistent filtering across all elements, letting you analyze specific data subsets without adjusting individual charts. You can also apply filter groups to specific containers to focus on certain data within them.
For example, in a workspace usage dashboard, a filter group can narrow data to a selected time period and update all charts, tables, and graphs accordingly.
 Apply multiple filters at the workspace-level
- Dashboard-level filters apply to all charts, regardless of their container.
- Container-level filters apply only to charts in a specific container.
Refer to Filter groups for more information.
Download a dashboard
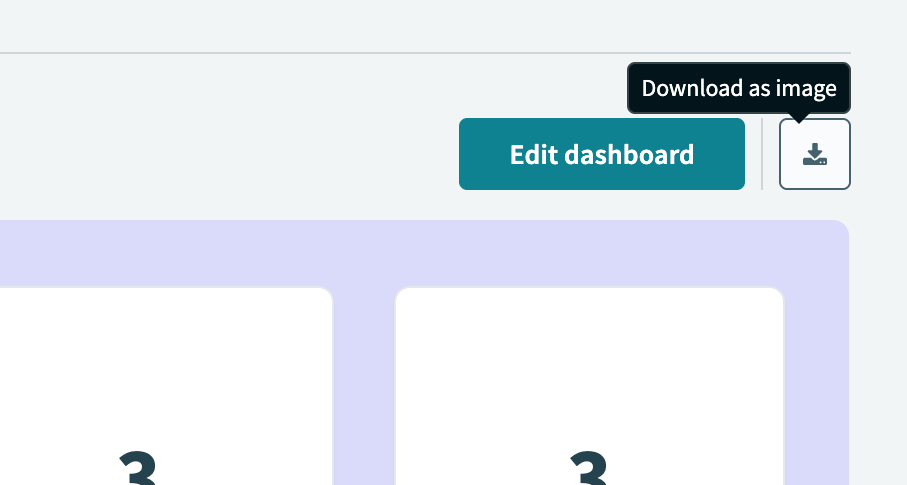
You can download Insights dashboards as a PNG file to share with stakeholders who don't have access to the Workato platform. This lets you share data visualizations while keeping underlying datasets and queries secure.
Complete the following steps to download a dashboard as a PNG file:
Go to Platform > Insights.
Select the dashboard.
Click Download as image.
 Download the dashboard as an image
Dashboard access and permissions
The charts you can view on a dashboard depend on your collaborator role and feature access. If you don't have access to a chart's underlying data source, the chart displays an error message instead of data.
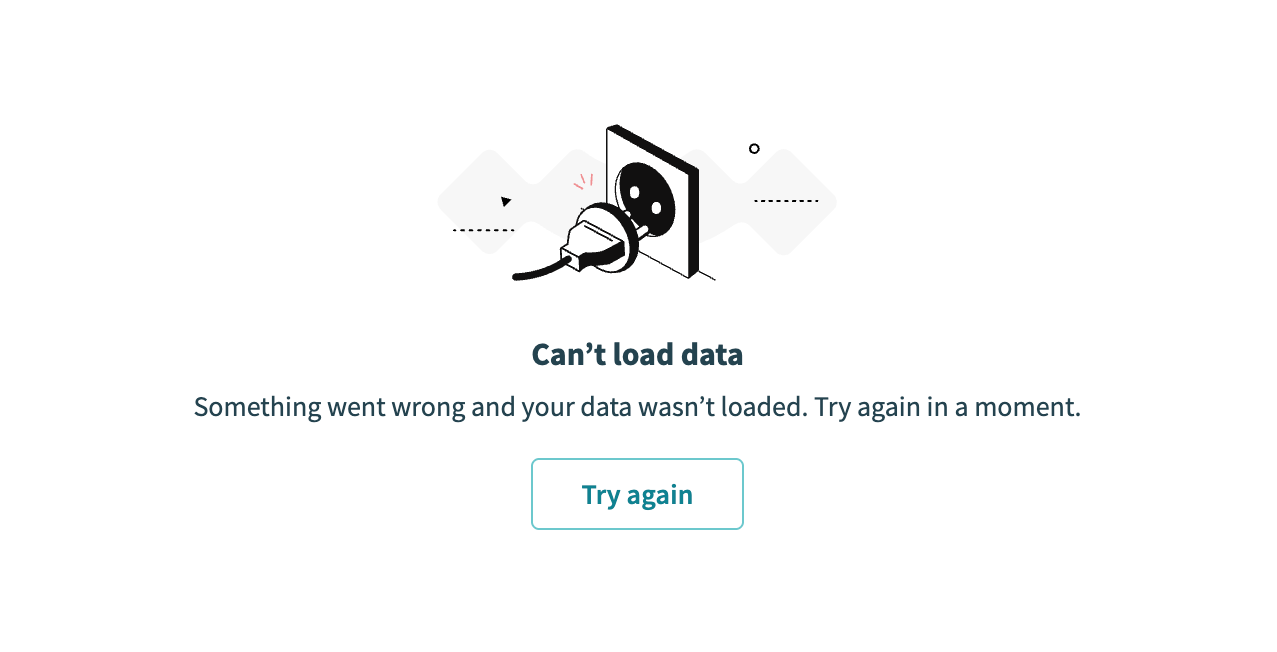 Charts display an error when you lack access to the data source
Refer to How roles and privileges affect data source access for more information.
Last updated: